NACo County Explorer examines the county role in infrastructure


Counties lead our nation’s infrastructure network. From building and maintaining roads and bridges to providing efficient transit systems, counties are a driving force connecting communities and strengthening our economy.
COUNTIES INVEST $134 BILLION IN BUILDING, MAINTAINING AND OPERATING PHYSICAL INFRASTRUCTURE AND PUBLIC WORKS
Share of Total County Infrastructure Spending, by Category, 2017

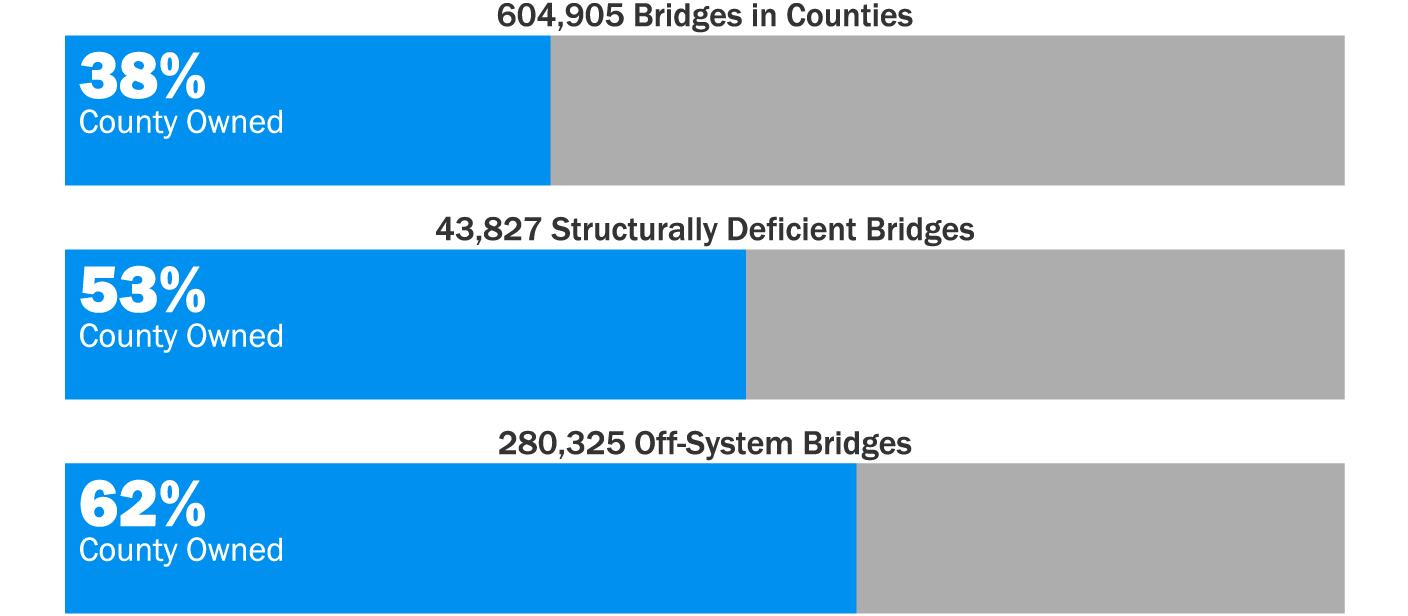
Counties own and maintain 38 percent of the more than 600,000 bridges that comprise the national bridge inventory. According to the American Society of Civil Engineers, 7.5 percent of the nation’s bridges are considered structurally deficient, and 178 million trips are taken across these bridges every day[1]. In 2020, more than 43,800 bridges were classified as structurally deficient and considered to be in poor condition, of which 53 percent are county owned. Off-system bridges comprise 46.3 percent (over 280,000 bridges) of the nation’s bridges.
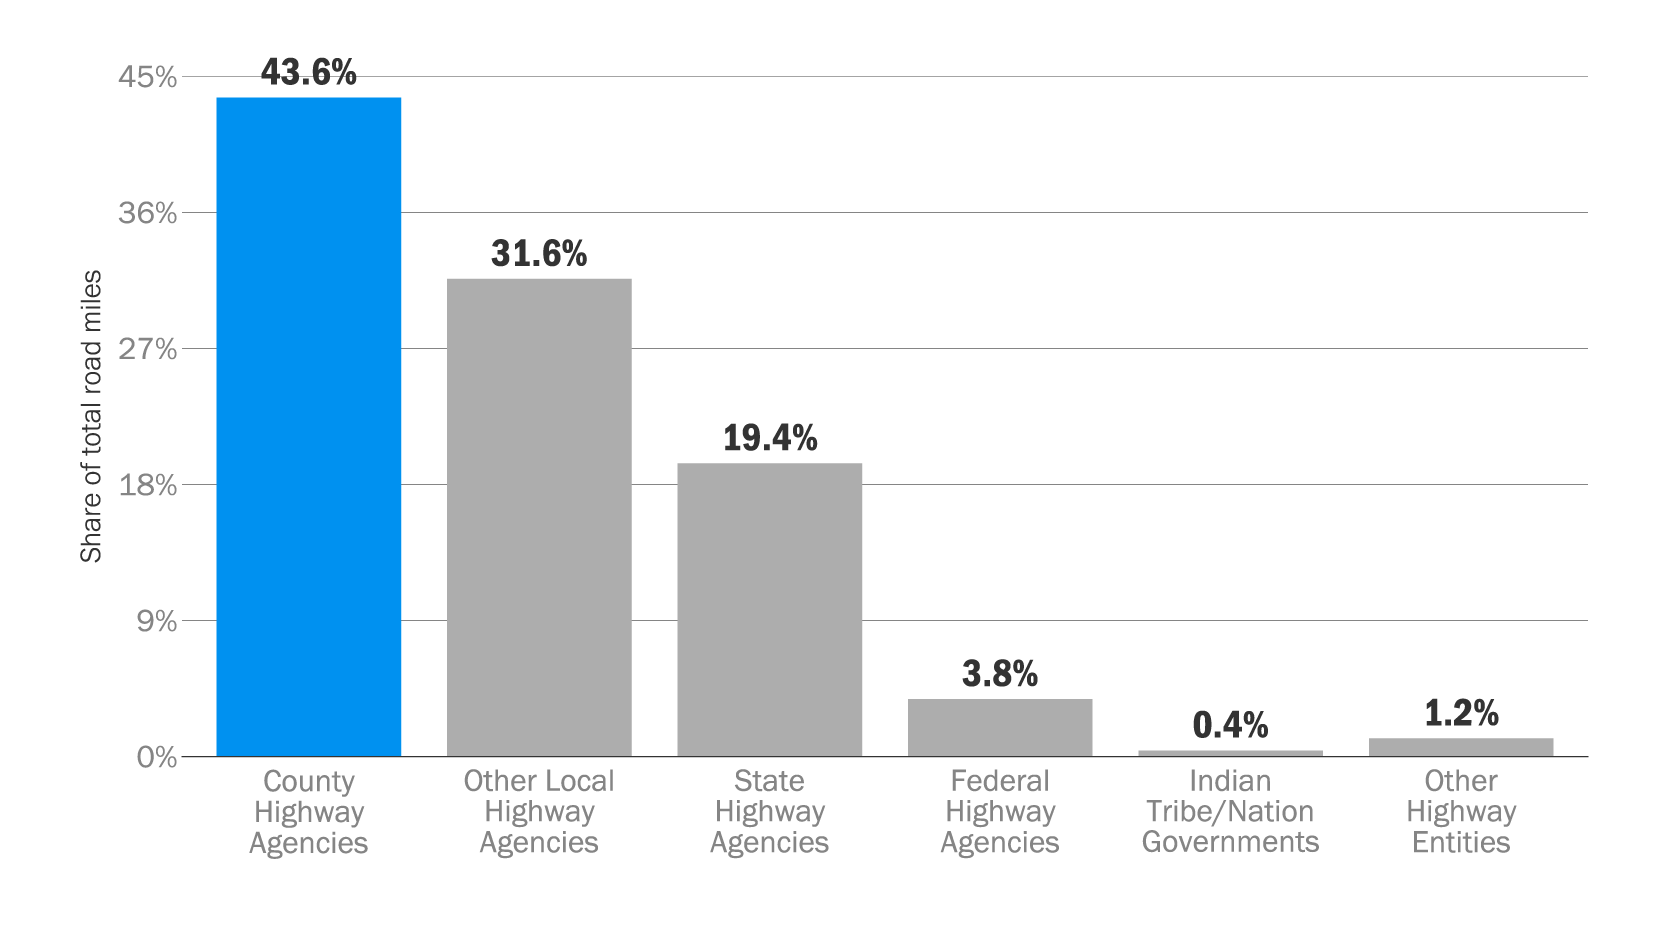
COUNTIES OWN AND MAINTAIN 44 PERCENT OF PUBLIC ROAD MILES
Breakdown of Ownership of Public Roads by Highway Agency, 2019
There are 4.1 million public road miles within counties across the nation where the majority of trips both start and end. Counties own and maintain 44 percent of these road miles. In total, local highway agencies including, cities, counties and municipalities, own and maintain 3.1 million road miles. In 2017, county governments invested $30.3 billion in the maintenance, operation, repair and construction of toll and non-toll highways.
COUNTIES ALSO SUPPORT 78 PERCENT OF TRANSIT AGENCIES AND 34 PERCENT OF AIRPORTS. ANNUALLY, COUNTIES INVEST:
- Over $23 billion in the operation, maintenance and construction of transit utilities and public mass transit systems, including subways, surface rails and buses.
- Over $6 billion in air transportation for the provision, operation, construction and support of airport facilities.
- Over $550 million in the operation, maintenance and support of sea and inland port facilities.
COUNTY EXPLORER RESOURCES: COUNTY INFRASTRUCTURE PROFILES
NACo's County Explorer tool provides county-level profiles which provide informative, statistical summaries based on available data. Check out your county’s latest individualized infrastructure profile on County Explorer.
Data Source and Notes
Sources: NACo Analysis of U.S. Census Bureau - Census of Individual Governments: Finance, 2017; NACo Analysis of National Bridge Inventory Data - Federal Highway Administration (FHWA), 2020; NACo Analysis of Federal Aviation Administration and Office of Aviation Analysis, U.S. Department of Transportation; NACo Analysis of U.S. Department of Transportation – Federal Highway Administration, Highway Performance Monitoring System; NACo Analysis of the U.S. Army Corps of Engineers (USACE) - National Inventory of Dams - 2019 Data and NACo Analysis of Federal Transit Administration (FTA) National Transit Database (NTD) Data, 2015.
Notes:
- The county expenditure analysis is based on revised estimates published by the U.S. Census Bureau in September 2020.
- All analysis is based on 3,069 counties with active county governments. Thus, Connecticut, Rhode Island and portions of Alaska, Massachusetts are excluded since they do not have active county governments. Independent cities in Virginia are also excluded from the analysis.
- For the county bridge data, effective Jan. 1, 2018, the Federal Highway Administration changed the definition of structurally-deficient bridges which limits the classification to bridges where one of the key structural elements — the deck, superstructure, substructure or culverts — are rated in poor or worse condition.
[1] American Society of Civil Engineers, 2021 Report Card for America’s Infrastructure, available at https://infrastructurereportcard.org/infrastructure-is-everywhere/ (2021).
Dive Deep on County Data
County Bridge Inventory
Related News

FY 25 Update: USDOT announces $982 million through Safe Streets and Roads for All Grant Program
On February 21, the U.S. Department of Transportation announced the availability of $1.2 billion through the Safe Streets and Roads for All competitive grant program in Fiscal Year 2024 for transportation safety planning or construction projects.

County promotes traffic safety with colorful crosswalks
Leon County, Fla., created elevated, colorful crosswalks to decrease speeding and increase pedestrian safety.

Rep. Sam Graves: ‘Compromise’ will get it done
The House Transportation and Infrastructure Committee chairman said the upcoming surface transportation reauthorization will focus on traditional infrastructure.